Take your place among the world's top retail banking leaders.
RBI's management-level programme in retail banking, helping you transform into a modern, digital, customer-centred retail bank.
Retail banking courses and qualifications
The Retail Banking Institute provides independent professional education and certification for individuals and organisations in the exciting field of retail banking, the main source of profits for most of the world's banks.
Our programmes are delivered online or in-house by Retail Banking Institute faculty who are experienced industry professionals that understand the day-to-day opportunities and challenges in retail banking.
Globally Recognised Professional Retail Banking Education for Leaders and Teams
At Retail Banking Institute, we provide globally respected retail banking training programmes that meet the needs of ambitious banking professionals at every stage of their careers. Our Certified International Retail Banker (CIRB) pathway is a three-tiered, blended learning programme designed to deliver practical, strategic, and leadership-level expertise in modern retail banking.
Whether you're a seasoned executive, a mid-level manager, or an emerging leader, the CIRB programme equips you with the tools to run, change, and lead the bank -- preparing you to navigate the future of financial services with confidence.
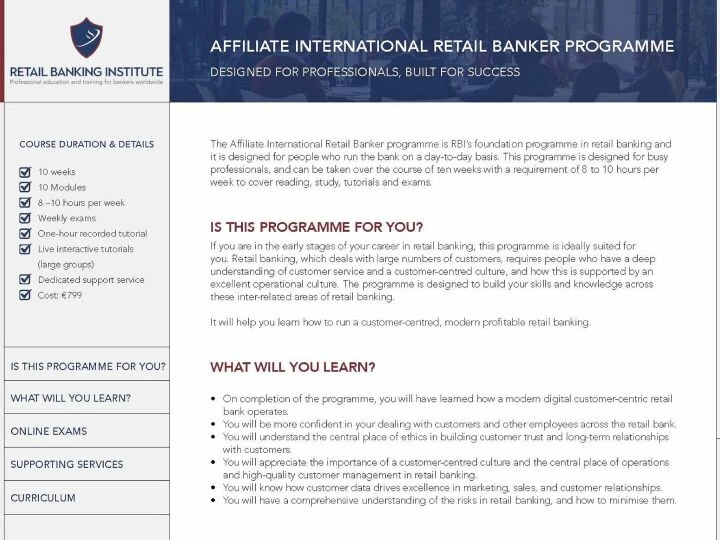
Affiliate Level – Run the Bank
The Affiliate programme builds strong foundations by focusing on customer-centric banking, compliance, and intelligent data management. Participants gain practical skills in customer service, sales, operations, and retail credit -- enhancing their ability to deliver value in a regulated, trust-based environment. This level is ideal for professionals developing core capabilities within retail banking.
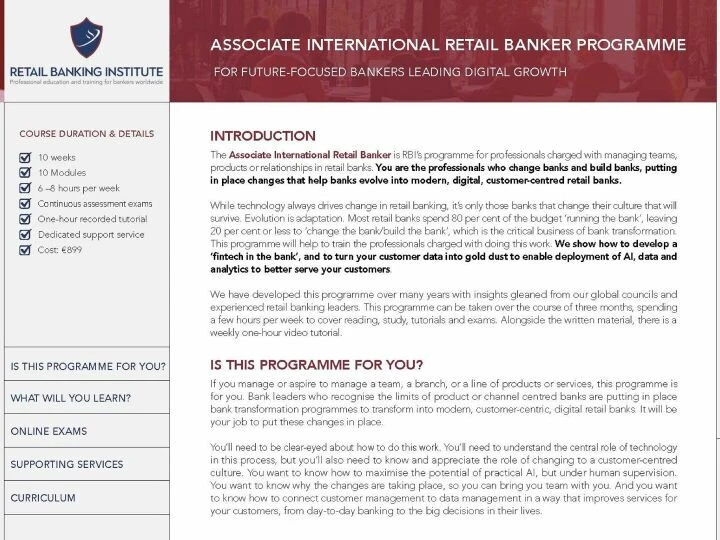
Associate Level – Change the Bank
The Associate programme is designed for managers driving innovation and growth. It focuses on advanced customer segmentation, personalised product development, and data-driven decision-making. Participants learn to increase agility and efficiency within the bank -- unlocking new revenue streams, enabling faster payments, and enhancing digital service delivery.
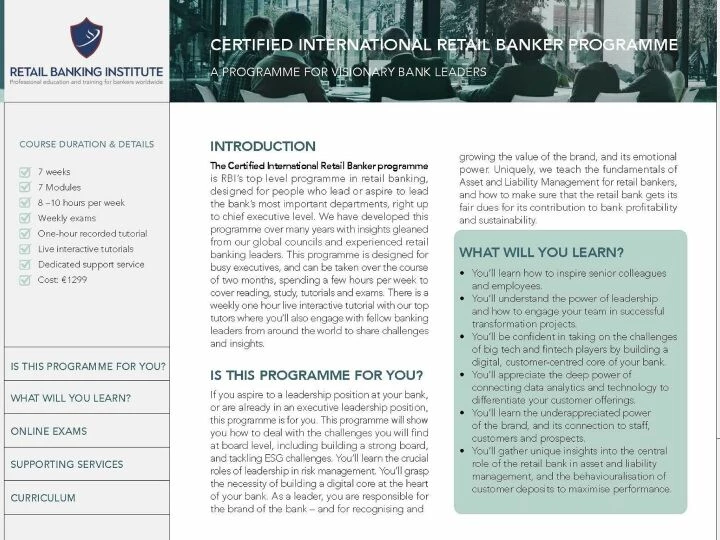
Certified Level – Lead the Bank
Aimed at senior leaders and executives, the Certified programme explores strategic leadership in the age of fintech disruption and digital transformation. Participants engage with real-world case studies and cutting-edge insights from RBI's Retail Banking Councils, gaining the foresight to lead successful retail banking transformation at scale.
Featured News & Updates


Testimonials
"It has been a great experience going through this program. The rich content and the experience of the facilitators coupled with great discussions during the weekly engagements have been worth the time. I must commend you and the entire team for the excellent support you've given us throughout the program."
William Danso-Abeam, Head of Consumer Products, Ecobank Ghana
"I am excited to be a Certified International Retail Banker. The sessions were very insightful, with case studies and practical ways very relevant in the day to day activities in Retail banking. The course facilitators were awesome, knowledgeable and provided clarity on any query raised by participants. The entire course is also very holistic covering key areas in retail leadership. I am delighted to be associated with Lafferty Group and look forward to more engagements as we drive Retail banking Strategies."
Nancy Ngathuku, Head Sourcing and Facilities Management, Co-Op Bank Kenya
"It was a truly inspiring journey which I will forever cherish and continue to stay on the growth track."
Prince Osei Hyeaman-Addai, Head, Mobile Financial Services, Fidelity Bank Ghana
"This course delivers a great broad range of insight across the key fundamentals aspiring senior Retail Banking leaders need to progress. I would thoroughly recommend business leaders place their top talent on the programme. Those that take the opportunity to network with tutors and other attendees will gain the most and equip themselves with the toolkit to excel in the next stage of their career."
David Hardisty, former Managing Executive Retail & Business Banking, Absa Kenya
Since the establishment of Lafferty Group 40 years ago, retail banking has been our main focus. It is a fascinating sector with vast potential for future growth. Retail banking helps the world's consumers, small businesses and the better off with their financial needs, from payments and savings to loans and investments. Investors value the sector highly, with stock market valuations of retail bank earnings often exceeding those of other banking sectors. We are proud to support the industry not only with education, knowledge and intelligence but also through our commitment to providing world-class professional retail banking education and internationally recognised Retail Banking training programmes.
Dr Ronan Lynch, Director, RBI
Discover the perfect programme tailored to your individual needs or company goals
Professional Retail Banking Education for the Future of Finance

Imagine the excitement of creating a modern, fully digital retail bank -- a bank managed by real professionals, with more potential than all the fintechs in the world. A bank prepared from day one to deal with climate change. A bank built on an unwavering ethical foundation.
This is the bank that the Certified International Retail Banker qualification is designed for and it's brought to life through our Professional retail banking education and globally recognised retail banking training programmes.


Lafferty Group
Contact Us
E: enquiries@lafferty.com
E: caroline.hastings@lafferty.com
The Leeson Enterprise Centre
Altamont Street
Westport, Co. Mayo
Ireland
F28 ET85